Pairs Trading Project
Team Members: Yunkai Gao, Jiajun Huang
What is Pairs Trading?
Pairs trading is a market-neutral strategy that matches a long position with a short position in two historically correlated stocks. It profits from temporary mispricings while being relatively hedged against market movements.
Why Choose Pairs Trading?
- Market neutral
- Statistical arbitrage
- Diversified and controllable risk
- Proven historical profitability
Pair Stock Selection
Same industry
- Similar fundamentals, Business models, Financial profiles
Statistical method
- Suppose P denotes the closing price of stock i at time t, where formation period t = 0,1,…,T
- Calculate standardized prices for stocks
- Calculate SSD of the standardized prices for stocks X and Y
- Select pairs with minimum SSD
Setting Trading Rules
Calculate 𝜇 and 𝜎
- Compute the mean and standard deviation of the standardized stock price spread during the formation period
Open position
- Standardized price spread between the two stocks < 𝜇−1.5𝜎 or > 𝜇+1.5𝜎
Close position
- If < 𝜇−1.5𝜎 , close position when the Standardized price spread back to 𝜇−0.2𝜎
- If > 𝜇+1.5𝜎 , close position when the Standardized price spread back to 𝜇+0.2𝜎
Stop-loss line
- If standardized price spread < 𝜇−2.5𝜎 or > 𝜇+2.5𝜎 after open position, we close position to stop loss.
Draw Standardized Price Spread Series Chart
- Normalized spreads, averages, opening lines, closing lines, and stop-loss lines.
Refinements and Advanced Methods
Pair Identifier
- Clustering: K-means, how to select hyperparam
- GNN: Stocks as nodes, pair relation as line, sector as subgraph
- Attention combined
Spread Construction
- Move beyond linear spread
- Use multi-factor approaches (fundamentals, technical indicators)
Signal Generation
- Reinforcement Learning (RL) for end-to-end decision making
- Ensemble learning for robustness
Capital Allocation
- Multi-objective optimization
Dynamic portfolio
- Rerank to fix unstable Pair relation
- Risk-contribution clear out
Data Example
- We selected the 150 most traded stocks from the S&P500 and made sure that each stock had ten years of trading data for our subsequent pair selection.
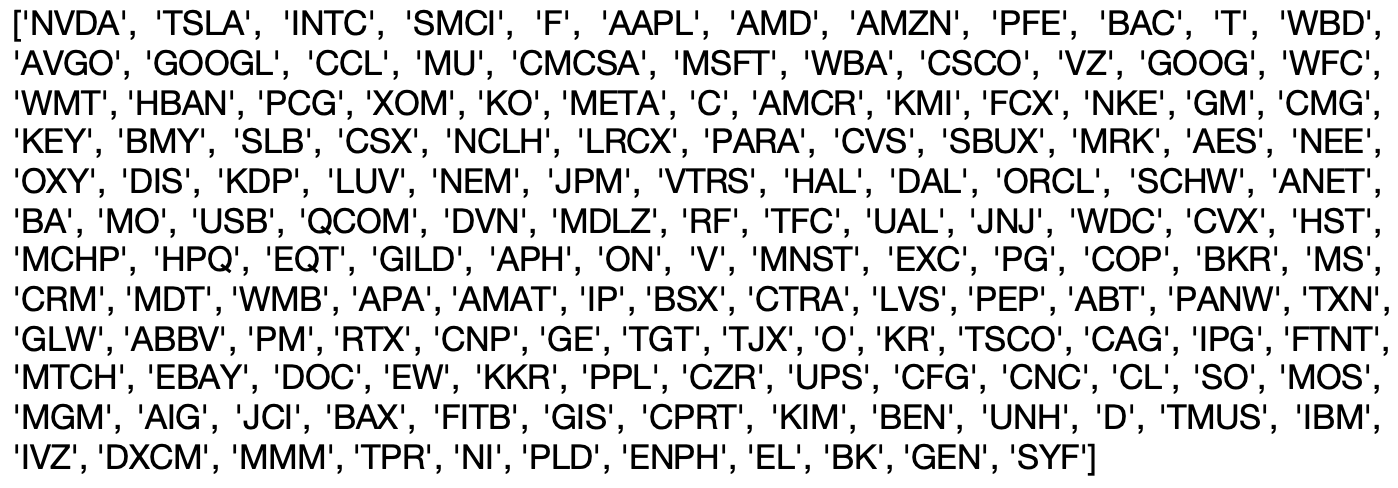
Stocks We Choose
- Here are 10 of the 150 stocks, we used one day of data as an example showing open, high, low, close, volumn.
| stock_idx | date | open | high | low | close | volume |
|---|---|---|---|---|---|---|
| AAPL | 2025-04-08 | 186.70 | 190.34 | 179.62 | 187.90 | 120859994 |
| AMCR | 2025-04-08 | 16.78 | 17.22 | 16.41 | 17.21 | 42828334 |
| AMD | 2025-04-08 | 96.72 | 98.66 | 93.52 | 95.22 | 46283727 |
| AMZN | 2025-04-08 | 185.23 | 186.93 | 178.57 | 183.98 | 58888478 |
| AVGO | 2025-04-08 | 167.25 | 169.53 | 157.89 | 162.91 | 53127980 |
| BAC | 2025-04-08 | 55.74 | 56.23 | 54.71 | 55.89 | 42930823 |
| C | 2025-04-08 | 52.39 | 53.64 | 50.21 | 52.28 | 38929745 |
| CCL | 2025-04-08 | 17.45 | 18.12 | 16.72 | 17.97 | 27893145 |
| CMCSA | 2025-04-08 | 40.73 | 41.98 | 39.22 | 40.56 | 35142789 |
| CSCO | 2025-04-08 | 52.26 | 52.97 | 51.69 | 52.10 | 29473815 |